Troubleshooting
This section is a refresher that provides an overview of the main concepts used to troubleshoot a Kubernetes cluster. At the end of this section, please complete the exercises to put these concepts into practice.
Log management 🔗
Logs allow users to:
- follow the cluster’s activity
- analyze errors
We must decouple log management from the workload (Containers, Pods) and from the Nodes.
Among the best practices:
- a container must log on stdout/stderr
- we should ship logs to a centralized logging solution
Different levels 🔗
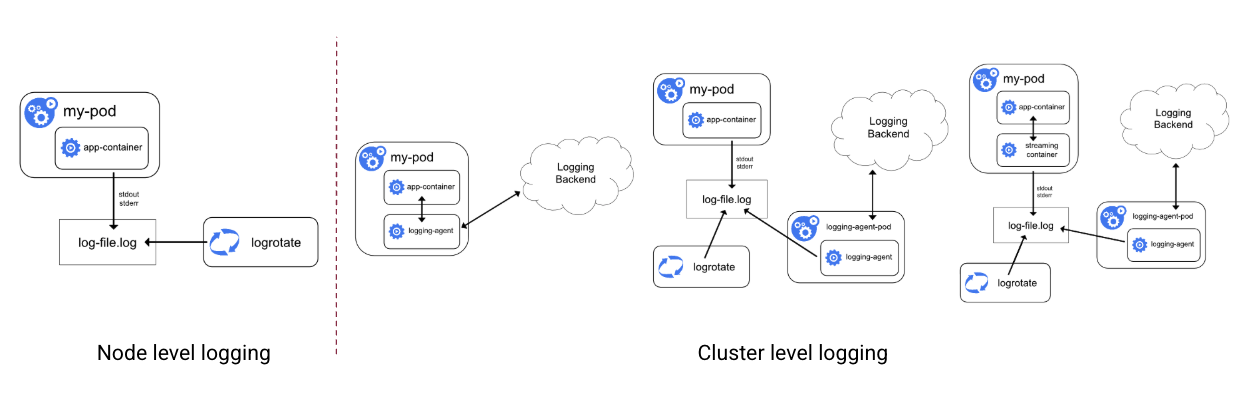
The following picture illustrates how we can configure logging on a cluster:
Node level: the container runtime stores the logs on the Node’s filesystem
Cluster level:
- the container directly ships logs to a centralized logging system
- the container runtime stores the logs on the Node’s filesystem, and then an external process (usually deployed as a DaemonSet) reads these logs and ships them to a centralized system
- a sidecar container is used to generate the logs on stdin/stdout, next the container runtime stores the logs on the Node’s filesystem, and then an external process reads these logs and ships them to a centralized system
Pods & Containers logs 🔗
The common way to get a Pod’s logs is using kubectl. First, we run a Pod based on the ghost image.
kubectl run ghost --image=ghost:4
Next, we can query the Pod’s logs.
$ kubectl logs ghost
[2025-04-24 13:05:39] INFO Ghost is running in production...
[2025-04-24 13:05:39] INFO Your site is now available on http://localhost:2368/
[2025-04-24 13:05:39] INFO Ctrl+C to shut down
[2025-04-24 13:05:39] INFO Ghost server started in 0.974s
...
We can also find these logs on the filesystem of the Node this Pod is running on. The following command tells us the Pod is running on worker1.
kubectl get po -o wide
NAME    READY   STATUS    RESTARTS   AGE     IP          NODE      NOMINATED NODE   READINESS GATES
ghost   1/1     Running   0          6m32s   10.0.0.96   worker1   <none>           <none>
The /var/log/pods folder on that Node contains the logs of all the Pods running on that Node, including the logs of the ghost Pod.
$ sudo ls /var/log/pods
default_ghost_c502bf3e-7671-4488-af0c-5a2f0908db41        kube-system_cilium-envoy-c5vhw_6ac2a2af-3945-4069-b1cc-bb257ace3884
default_mongo_331fa933-e9cf-42f8-94c0-93fe5e5d6e82        kube-system_cilium-vhtbk_b9548366-e92e-4c97-ba78-87c7b702cf28
default_podinfo_c146441a-ba30-41cd-8e99-80feb7f12afe      kube-system_kube-proxy-szfrd_17d684c2-a4ff-4316-b855-6f1ff63e5a0b
We get the same content we had using kubectl.
$ sudo cat /var/log/pods/default_ghost_c502bf3e-7671-4488-af0c-5a2f0908db41/ghost/0.log
2025-04-24T13:05:39.159890159Z stdout F [2025-04-24 13:05:39] INFO Ghost is running in production...
2025-04-24T13:05:39.161339474Z stdout F [2025-04-24 13:05:39] INFO Your site is now available on http://localhost:2368/
2025-04-24T13:05:39.161693705Z stdout F [2025-04-24 13:05:39] INFO Ctrl+C to shut down
2025-04-24T13:05:39.165232139Z stdout F [2025-04-24 13:05:39] INFO Ghost server started in 0.974s
Still from worker1, we can get containers’ logs in /var/log/containers
$ sudo ls /var/log/containers
cilium-envoy-c5vhw_kube-system_cilium-envoy-e73d79abd769cfa05f392807ca4ebacf7103b0049c19b2787e0e5128afe42f4d.log
cilium-vhtbk_kube-system_apply-sysctl-overwrites-7ac45e4b75302714bdbcc44da611b733a40a199a19d160e01a9496749920f043.log
cilium-vhtbk_kube-system_cilium-agent-9226fca5f50ebdc539e8045cece3e3cc9606b82e66ae67fb87a35b270fb71b96.log
cilium-vhtbk_kube-system_clean-cilium-state-5d9e303fbc85ad62e0f2e41be4b74ecfe6e7d989160dcdcef915006f5b6b308d.log
cilium-vhtbk_kube-system_config-3b3d66e2580dcf07baefe4dd9c792a08f7a41e16789ff07d6cb737b461b6b1a2.log
cilium-vhtbk_kube-system_install-cni-binaries-c039337274f5f8e09f0d886e2be9ae71356dff5cf25a2c0ed153b3d3bf2fe656.log
cilium-vhtbk_kube-system_mount-bpf-fs-935a17f160e800340dd1b9a7bdc294be3eec8628208fd0c36bb924b6345e9ed4.log
cilium-vhtbk_kube-system_mount-cgroup-b20b1292b4a4daed58ec5b7291b1a3744b249b19eca208ede650761b85a2f7fa.log
ghost_default_ghost-f0154dc4e4572d3827ba70717fba1caf19e0dcbea9060cde65965a424f9f3a3e.log <- this one
kube-proxy-szfrd_kube-system_kube-proxy-d2301ac47955299ea54ed4ed53a19d3af51b1f52156f01271a15a417db5fdd8c.log
mongo_default_mongo-70628c097a2032abd76d0716e62635378befb7efb077b787581eb86d195535f4.log
podinfo_default_podinfo-5e99fed167e8338e2d11b8e337fb3490522dc7c601ee83e60f85e80c5d7d4f4a.log
Control plane logs 🔗
We can get the logs of the control plane components (API Server, etcd, controller-manager, and scheduler) with kubectl. The following command allows us to get the logs of the API Server running on the controlplane Node.
kubectl -n kube-system logs kube-apiserver-controlplane
The logs of these components are available on the controlplane Node, which is the Node they are running on.
$ sudo ls -al /var/log/pods
total 36
drwxr-xr-x 9 root root 4096 Apr 22 15:10 kube-system_cilium-cm954_1af09dcb-9738-458f-bb94-335505f7d713
drwxr-xr-x 3 root root 4096 Apr 22 15:10 kube-system_cilium-envoy-ksqxr_d3a09feb-0827-4e80-84e6-1a960377bf0c
drwxr-xr-x 3 root root 4096 Apr 22 15:05 kube-system_etcd-controlplane_05261863f509698b43b78850b9ccfe8f
drwxr-xr-x 3 root root 4096 Apr 22 15:05 kube-system_kube-apiserver-controlplane_80c4d1003f6284601e0aa670932b5ee7
drwxr-xr-x 3 root root 4096 Apr 22 15:05 kube-system_kube-controller-manager-controlplane_2c3d35add706c540cb5a3ad3a246bee9
drwxr-xr-x 3 root root 4096 Apr 22 15:05 kube-system_kube-proxy-n5lct_6b0c2017-b4b1-4ef3-9678-e3d3dc8687e8
drwxr-xr-x 3 root root 4096 Apr 22 15:05 kube-system_kube-scheduler-controlplane_4a834c796528f3fc43f3dadb50f3bd73
...
Kubelet logs 🔗
The kubelet agent, running on each Node of the cluster, is managed by systemd. We can use journalctl to get its logs.
sudo journalctl -u kubelet | less
Metrics management 🔗
In Kubernetes, metrics come in various types, originate from different layers of the stack, and are exposed by multiple components.
Types of Metrics:
- CPU / RAM usage
- Disk I/O
- Network activity
- Request and error rates
Sources of Metrics:
- Cluster-wide
- Control plane
- Individual Nodes
- Pods and containers
- Applications
Metrics Producers:
- cAdvisor (embedded in kubelet)
- Metrics Server
- Kubernetes API Server
- Node Exporter
- kube-state-metrics
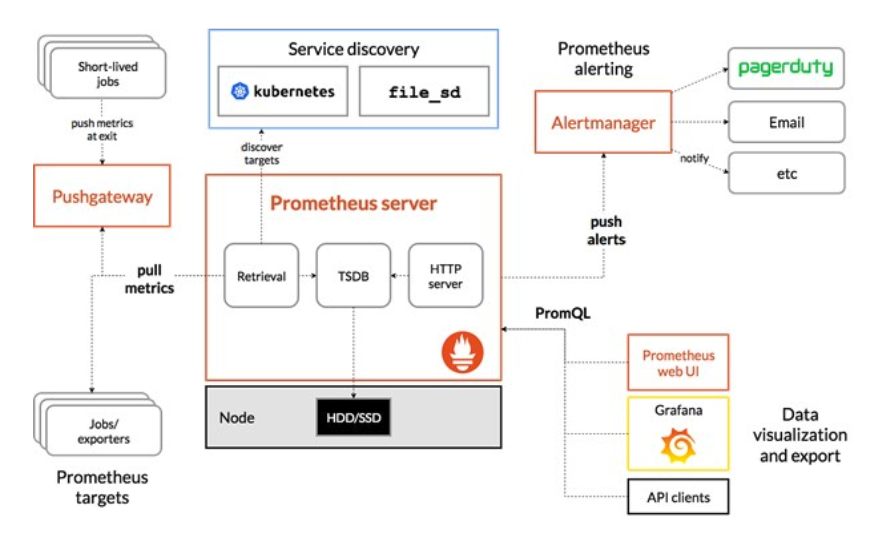
Prometheus-based solution 🔗
The Prometheus stack is a widely used solution to manage Metrics in a Kubernetes cluster.
Metrics server 🔗
The metrics-server is a lightweight component that is not installed by default in Kubernetes. It gets CPU / RAM usage in real time but does not store history. Other resources, such as HorizontalPodAutoscaler (HPA), use it to increase/decrease the number of Pods based on resource consumption.
The metrics-server brings additional kubectl commands to get the usage of resources in the cluster.
- Getting the CPU and RAM in use by the cluster’s Nodes
kubectl top nodes
- Getting the CPU and RAM in use by individual Pods
kubectl top pods
Cluster components 🔗
Each control plane component is a static Pod. The /etc/kubernetes/manifests folder of the controlplane Node contains all their YAML specifications. These Pods are directly managed by kubelet.
$ ls /etc/kubernetes/manifests
etcd.yaml  kube-apiserver.yaml  kube-controller-manager.yaml  kube-scheduler.yaml
For each static Pod, kubelet automatically creates a mirror Pod that appears in the Kubernetes API.
$ kubectl get po -n kube-system
coredns-64897985d-gfslg                  1/1     Running   0          46h
coredns-64897985d-q7qd2                  1/1     Running   0          107s
etcd-controlplane                        1/1     Running   0          5d17h   <- mirror Pod
kube-apiserver-controlplane              1/1     Running   0          5d17h   <- mirror Pod
kube-controller-manager-controlplane     1/1     Running   1 (3d1h ago)   5d17h   <- mirror Pod
kube-proxy-25w94                         1/1     Running   0          5d17h
kube-proxy-778cb                         1/1     Running   0          5d17h
kube-proxy-h4hbh                         1/1     Running   0          5d17h
kube-scheduler-controlplane              1/1     Running   1 (3d1h ago)   5d17h   <- mirror Pod
weave-net-66dtm                          2/2     Running   1 (5d17h ago)   5d17h
weave-net-pfcrp                          2/2     Running   1 (5d17h ago)   5d17h
weave-net-zxchk                          2/2     Running   1 (5d17h ago)   5d17h
Troubleshooting - Examples 🔗
Application failure - Example 1 🔗
The following specification seems valid for deploying a Pod based on the elasticsearch image.
apiVersion: v1
kind: Pod
metadata:
  name: es
spec:
  containers:
  - image: elasticsearch:7.6.2
    name: es
After waiting a few dozen seconds following the creation of this Pod, we begin to see some errors.
$ kubectl get pods/es -w
NAME   READY   STATUS              RESTARTS   AGE
es     0/1     ContainerCreating   0          10s
es     1/1     Running             0          22s
es     0/1     Error               1          58s
es     0/1     CrashLoopBackOff    1          70s
To understand the origin of these errors, we first need to use the describe command to get more details.
$ kubectl describe po/es
Events:
  Type     Reason     Age                   From               Message
  ----     ------     ----                  ----               -------
  …
  Normal   Pulled     52s (x4 over 3m16s)   kubelet, workers-1i2u   Container image "elasticsearch:7.6.2" already present on machine
  Warning  BackOff    19s (x9 over 2m57s)   kubelet, workers-1i2u   Back-off restarting failed container
Next, we verify the application logs. It shows the root cause: the value of the kernel property vm.max_map_count is too low.
$ kubectl logs po/es
[2020-03-15T17:42:15,417][INFO ][o.e.b.BootstrapChecks    ] [hK4xzxV] bound or publishing to a non-loopback address, enforcing bootstrap checks
ERROR: [1] bootstrap checks failed
[1]: max virtual memory areas vm.max_map_count [65530] is too low, increase to at least [262144]
[2020-03-15T17:42:15,429][INFO ][o.e.n.Node               ] [hK4xzxV] stopping ...
[2020-03-15T17:42:15,483][INFO ][o.e.n.Node               ] [hK4xzxV] stopped
We should use an initContainer and an env var to fix the thing for this specific example.
apiVersion: v1
kind: Pod
metadata:
  name: es
spec:
  initContainers:
  - name: increase-vm-max-map
    image: busybox
    command: ["sysctl", "-w", "vm.max_map_count=262144"]
    securityContext:
      privileged: true
  containers:
  - image: elasticsearch:7.6.2
    name: es
    env:
    - name: discovery.type
      value: single-node
Application failure - Example 2 🔗
Let’s consider a Pod exposed with a Service.
kubectl get po,svc -l app=ghost
NAME READY STATUS RESTARTS AGE
pod/ghost 1/1 Running 0 88s
NAME TYPE CLUSTER-IP EXTERNAL-IP PORT(S) AGE
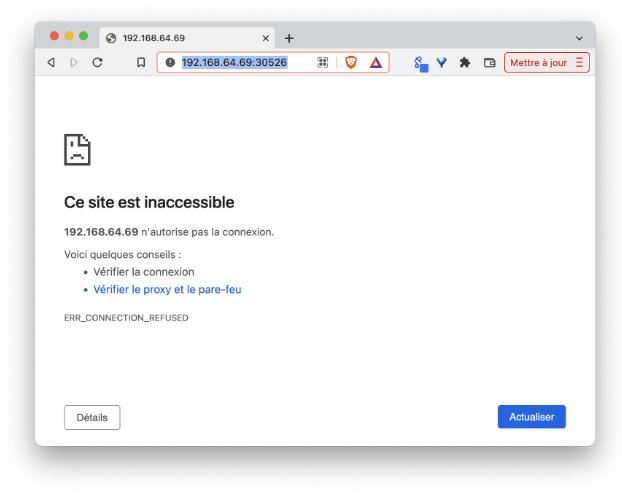
service/ghost NodePort 10.43.121.142 <none> 2368:30526/TCP 88s
It happens that the application is not reachable via the NodePort provided.
In this case, we can first describe the Service and check the Endpoints. In the following example, Endpoints is empty, which indicates we did not configure the Service correctly.
k describe svc ghost
Name:                     ghost
Namespace:                default
Labels:                   app=ghost
Annotations:              <none>
Selector:                 run=ghost
Type:                     NodePort
IP Family Policy:        SingleStack
IP Families:              IPv4
IP:                       10.43.121.142
IPs:                      10.43.121.142
Port:                     <unset>  2368/TCP
TargetPort:               2368/TCP
NodePort:                 <unset>  30526/TCP
Endpoints:                <none>
Session Affinity:         None
External Traffic Policy:  Cluster
Events:                   <none>
The list of Endpoints is empty, so the service does not expose a single Pod.
There is a mismatch between the Service’s selector and the pod labels:
- Service’s selector is
run: ghost - Pod’s label is
app: ghost
In this case, we need to change one of them to ensure they match.
Failure of the API Server 🔗
If kubectl commands hang, that may be because the API Server is not available.
$ kubectl get po
... hanging
From the controlplane, we first check the kubelet’s logs. In this example, the logs indicate the API Server encounters a problem to start.
Checking kubelet logs
$ sudo journalctl -u kubelet | less
sudoMar 31 09:49:17 controlplane kubelet[72558]: E0331 09:49:17.443398 72558 pod_workers.go:919] "Error syncing pod, skipping" err="failed to \"StartContainer\" for \"kube-apiserver\" with CrashLoopBackOff: \"back-off 2m40s restarting failed container=kube-apiserver pod=kube-apiserver-controlplane_kube-system(1379f6cdef52f9b598e745122eb20d6f)\"" pod="kube-system/kube-apiserver-controlplane" podUID=1379f6cdef52f9b598e745122eb20d6f
Mar 31 09:49:18 controlplane kubelet[72558]: E0331 09:49:18.426742 72558 kubelet_node_status.go:460] "Error updating node status, will retry" err="error getting node \"controlplane\": Get \"https://194.182.171.68:6443/api/v1/nodes/controlplane?timeout=10s\": context deadline exceeded"
…
We retrieve the name of the API Server’s log file from the /var/log/pods folder on the controlplane Node.
$ ls -al /var/log/pods
total 40
drwxr-xr-x 10 root root 4096 Mar 31 09:45 .
drwxrwxr-x 10 root syslog 4096 Mar 31 00:00 ..
drwxr-xr-x  3 root root 4096 Mar 29 10:38 kube-system_coredns-64897985d-gfslg_adaa9cfe-42a4-4bc7-b5aa-eb0313b59fe7
drwxr-xr-x  3 root root 4096 Mar 28 08:55 kube-system_coredns-64897985d-mvp4t_bcfea69a-d6cc-4baf-a795-acad8fab2e47
drwxr-xr-x  3 root root 4096 Mar 25 16:05 kube-system_etcd-controlplane_6d694021cab77267a88779a2268199e6
drwxr-xr-x  3 root root 4096 Mar 31 09:44 kube-system_kube-apiserver-controlplane_1379f6cdef52f9b598e745122eb20d6f  <- this one
drwxr-xr-x  3 root root 4096 Mar 26 13:46 kube-system_kube-controller-manager-controlplane_94d947d1226129a82876a3b7d829bbfc
drwxr-xr-x  3 root root 4096 Mar 25 16:06 kube-system_kube-proxy-25w94_0c17e655-c491-43f6-b012-0eab0c7f8071
drwxr-xr-x  3 root root 4096 Mar 26 13:46 kube-system_kube-scheduler-controlplane_415ed7d85341035184628df29257fa2f
drwxr-xr-x  5 root root 4096 Mar 25 16:06 kube-system_weave-net-66dtm_cef2efd7-9ea6-4604-a871-53ab915a7a84
From that file, we directly understand why the API Server cannot start: an invalid configuration option is used in its specification.
sudo cat kube-system_kube-apiserver-controlplae_1379f6cdef52f9b598e745122eb20d6f/kube-apiserver/8.log
2022-03-31T10:00:27.785052657Z stderr F I0331 10:00:27.784813       1 server.go:565] external host was not specified, using 10.62.50.215
2022-03-31T10:00:27.785838518Z stderr F E0331 10:00:27.785689       1 run.go:74] "command failed" err="enable-admission-plugins plugin \"WRONG_STUFF_HERE\" is unknown"
Still, from the controlplane Node, we can check the API Server specification (/etc/kubernetes/manifests/kube-apiserver.yaml) and fix the incorrect configuration.
apiVersion: v1
kind: Pod
metadata:
  annotations:
    kubeadm.kubernetes.io/kube-apiserver.advertise-address.endpoint: 10.62.50.215:6443
  creationTimestamp: null
  labels:
    component: kube-apiserver
    tier: control-plane
  name: kube-apiserver
  namespace: kube-system
spec:
  containers:
  - command:
    - kube-apiserver
    - --advertise-address=10.62.50.215
    - --allow-privileged=true
    - --authorization-mode=Node,RBAC
    - --client-ca-file=/etc/kubernetes/pki/ca.crt
    - --enable-admission-plugins=NodeRestriction,WRONG_STUFF_HERE  <- ,WRONG_STUFF_HERE needs to be removed
    - --enable-bootstrap-token-auth=true
    ...
Once the specification is changed, kubelet automatically restarts the API Server Pod.
Failure of a worker node 🔗
Sometimes, a Node may not be in the Ready state as illustrated below.
$ kubectl get nodes
NAME           STATUS     ROLES           AGE     VERSION
controlplane   Ready      control-plane   5d19h   v1.32.2
worker1        NotReady   <none>          5d19h   v1.32.2  <- This Node does not seem to work
worker2        Ready      <none>          5d19h   v1.32.2
We start by getting more information about this Node to troubleshoot this issue.
kubectl describe nodes worker1
Name:               worker1
Taints:             node.kubernetes.io/unreachable:NoExecute
                   node.kubernetes.io/unreachable:NoSchedule
…
Conditions:
  Type                 Status    LastHeartbeatTime                 LastTransitionTime                Reason              Message
  ----                 ------    -----------------                 ------------------                ------              -------
  NetworkUnavailable   False     Fri, 25 Mar 2022 16:06:39 +0000   Fri, 25 Mar 2022 16:06:39 +0000   WeaveIsUp           Weave pod has set this
  MemoryPressure       Unknown   Thu, 31 Mar 2022 11:40:16 +0000   Thu, 31 Mar 2022 11:43:35 +0000   NodeStatusUnknown   Kubelet stopped posting node status.
  DiskPressure         Unknown   Thu, 31 Mar 2022 11:40:16 +0000   Thu, 31 Mar 2022 11:43:35 +0000   NodeStatusUnknown   Kubelet stopped posting node status.
  PIDPressure          Unknown   Thu, 31 Mar 2022 11:40:16 +0000   Thu, 31 Mar 2022 11:43:35 +0000   NodeStatusUnknown   Kubelet stopped posting node status.
  Ready                Unknown   Thu, 31 Mar 2022 11:40:16 +0000   Thu, 31 Mar 2022 11:43:35 +0000   NodeStatusUnknown   Kubelet stopped posting node status.
…
The result above indicates that the kubelet process running on worker1 has stopped posting the Node’s status, which might indicate that process no longer runs. In that case, we can check the status of the kubelet systemd service on worker1.
Checking the status of the node's kubelet
sudo systemctl status kubelet
● kubelet.service - kubelet: The Kubernetes Node Agent
   Loaded: loaded (/lib/systemd/system/kubelet.service; enabled; vendor preset: enabled)
  Drop-In: /etc/systemd/system/kubelet.service.d
           └─10-kubeadm.conf
   Active: inactive (dead) since Thu 2022-03-31 11:42:53 UTC; 4min 29s ago
     Docs: https://kubernetes.io/docs/home/
  Process: 66511 ExecStart=/usr/bin/kubelet $KUBELET_KUBECONFIG_ARGS $KUBELET_CONFIG_ARGS $KUBELET_KUBEADM_ARGS $KUBELET_EXTRA_ARGS (code=exited, status=0/SUCCESS)
 Main PID: 66511 (code=exited, status=0/SUCCESS)

Mar 31 11:35:14 worker1 kubelet[66511]: I0331 11:35:14.894783   66511 image_gc_manager.go:327] "Attempting to delete unused images"
Mar 31 11:35:14 worker1 kubelet[66511]: I0331 11:35:14.916929   66511 eviction_manager.go:349] "Eviction manager: must evict pod(s) to reclaim" resourceName="ephemeral-storage"
Mar 31 11:35:14 worker1 kubelet[66511]: I0331 11:35:14.916992   66511 eviction_manager.go:367] "Eviction manager: pods ranked for eviction" pods=[kube-system/weave-net-zxchk kube-system/kube-proxy-778cb]
...
As kubelet is not running, we can restart it.
sudo systemctl restart kubelet
Practice 🔗
You can now jump to the Exercises part to learn and practice the concepts above.